Detailed statistics
Dernière mise à jour
Dernière mise à jour
From the dashboard you can access detailed statistics by clicking on the “See all statistics” button located at the bottom left of the Dashboard graph.
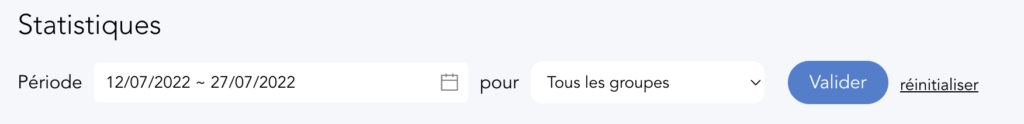
On the page you will be able to obtain a finer and more precise view of your statistics by filtering by:
period: by choosing an analysis start date and an end date,
learner group: by choosing all groups or a specific group of learners.
The statistics will then be updated by clicking on the “Validate” button.
Below the filtered statistics graph, you will find a table showing the most viewed training courses.
This table is updated at the same time as your filters (period / learner group).
You can also access detailed statistics for a specific training course by clicking on the “Stats” link located to the right of the corresponding line.
Advice
Click the "Update" button at the top right of the table if you want more recent data (the date and time the statistics were calculated is indicated).